
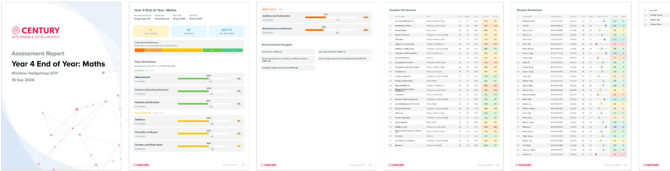
Every Baseline and End of Year Assessment on CENTURY is auto-marked and produces a report automatically as soon as its assessment window closes, both for each individual student and for the class or year group as a whole.
Every report starts from a raw score (the number of items a student answered correctly). Most assessments currently present that raw score alongside a topic-by-topic breakdown in an Academic Assessment Report. Once an assessment's standardisation is complete and published (currently true for Year 5 and Year 6 Baselines) it instead produces a standardised report, converting the raw score into a standardised score and stanine and adding a comparison against a national sample. This page covers both, plus how to track progress and get more out of your data.
Table of Contents
- Interpreting Academic Assessment Reports
- Interpreting Standardised Reports
- Downloading your data
- Getting started
Interpreting Academic Assessment Reports
Academic Assessment Reports currently apply to all End of Year Assessments, and to Baseline Assessments for every year group except Year 5 and Year 6 as these have full standardised reports. Two report levels are generated for every assessment window: a report for each student, and a report for the classes who sat the assessment as a whole.
Cohort-level report
- Headline stats – Avg. Score, number of Students, Avg. Time Taken, and the percentage of Questions Seen.
- Topic Breakdown – the group's average score per topic.
- Strengths – the questions with the most correct answers across the group.
- Areas for Improvement – the questions with the fewest correct answers across the group.
- Recommended Nuggets – content to assign to the whole class or group.
- Question Breakdown – for every question: how many students saw it and how many got it right.
- Student Breakdown – one row per student, with their Time Taken, Questions Seen, Correct answers, and Score.
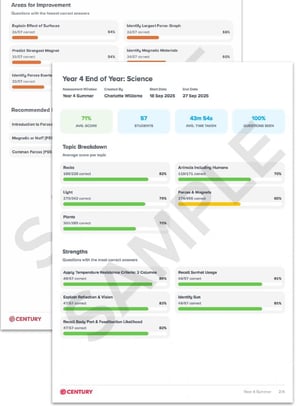
A cohort report's Topic Breakdown, Strengths and Areas for Improvement sections.
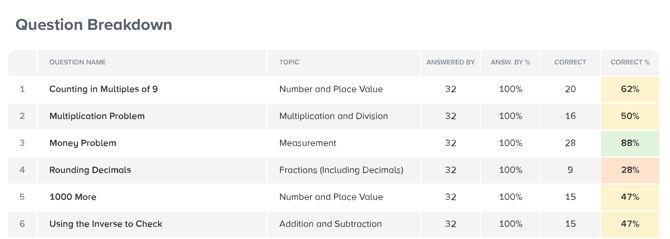
The Question Breakdown table in a cohort report. Rows are highlighted where the correct percentage is low, making it easy to spot questions the group as a whole struggled with.
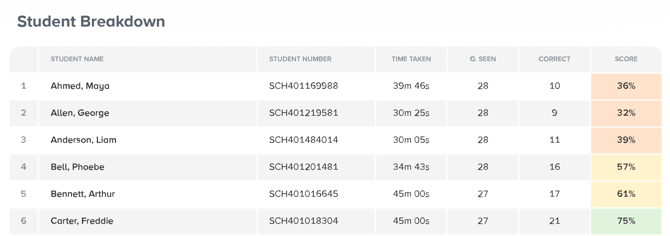
The Student Breakdown table at the end of a cohort report, with one row per student.
Student-level report
- Headline stats – Score, Time Taken, Questions Seen, and Correct Answers.
- Topic Breakdown – score per topic, shown as both a fraction and a percentage.
- Recommended Nuggets – CENTURY content linked to the topics the student struggled with.
- Question Breakdown – a table listing every Question Name, its Topic, and a Result.
Note: The Result column shows Correct, Incorrect, or Skipped for every question the student actually reached, but is left blank for any question further along that they didn't get to.
How to read an Academic Assessment Report
Use Strengths and Areas for Improvement as your fastest read of what the class needs next, then use the full Topic Breakdown to see how that plays out subject-wide. If a topic score looks low, check the Question Breakdown to see whether it's one tricky question dragging the average down, or a genuine gap across several questions in that topic.
Interpreting standardised reports
Click here to view our quick-start guide on interpreting standardised reports on CENTURY.
Standardised reporting currently applies to Year 5 and Year 6 Baseline Assessments only. A standardised report includes everything described above, plus a comparison against a representative national sample of students who sat the same assessment at the same point in the year, on the same scale used consistently across every CENTURY standardised assessment.
Standardised score and stanine
Each student's raw score is converted into a standardised score (mean 100, standard deviation 15) and a stanine, a 1–9 band that groups similar scores together. Stanines 1–3 are below average, 4–6 are average, and 7–9 are above average. This scale and banding mean the same thing on every CENTURY standardised assessment, so scores are comparable wherever you see them.
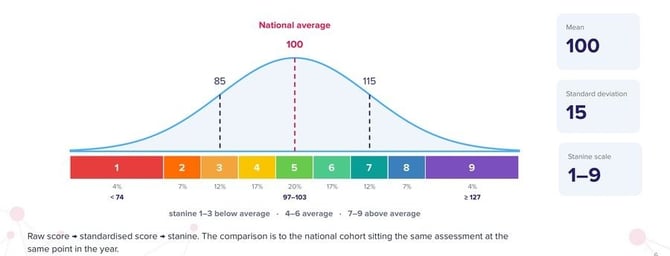
Class stanine distribution
Alongside each student's own score, the cohort report gives a mean standardised score and mean stanine for the group, plus a class stanine distribution: how your class or year group spreads across all nine stanines. Two classes can have the same average standardised score but a very different spread, for example one class bunched in the middle stanines versus another split between low and high performers, and that shape matters just as much as the average when you're planning.
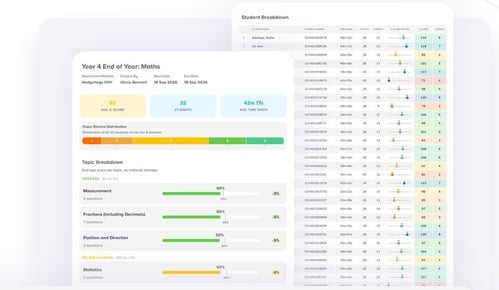
Example of a standardised cohort report, showing the class stanine distribution alongside each student's standardised score and stanine.
Topic breakdown against the national average
In a standardised report, the Topic Breakdown bands every topic against the national average for that topic, rather than just showing your group's own score in isolation:
- Average, within 5% of the national average either way
- Below Average, 5–15% below the national average
- Needs Focus, more than 15% below the national average
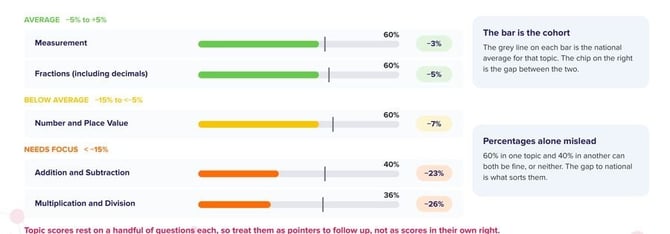
The bar shows your cohort's score; the grey line marks the national average for that topic; the chip on the right is the gap between the two.
Topic scores are usually based on a handful of questions each, so treat a "Needs Focus" band as a pointer to investigate in the Question Breakdown, not as a precise measurement in its own right.
Why standardised, not age-standardised
CENTURY’s assessments measure attainment against the National Curriculum expectations for a year group, so each student is compared against the national cohort sitting the same assessment at the same point in the academic year, regardless of small age differences within the year group.
Every score has a margin of error
Like any assessment, a standardised score is a best estimate on the day, not a perfectly precise number. A typical margin of error for an assessment is around 5 standardised score points either side of a result. Two students scoring 98 and 102 shouldn't be read as meaningfully different; two students scoring 90 and 110 probably do differ meaningfully.
Tip: As a rough rule of thumb, be cautious about reading too much into a difference of less than around 20 standardised score points between two scores.
What these scores don't tell you
- They're not absolute mastery. A standardised score shows where a student sits relative to the national cohort, not a fixed pass/fail line for what they have or haven't mastered.
- They're not a statutory assessment. Use them alongside other classroom evidence, not as a replacement for national tests such as KS2 SATs, the Year 4 Multiplication Tables Check, or phonics screening.
- Topic-level scores are diagnostic, not standardised. They carry more measurement error than the overall standardised score, so use them to spot candidate gaps rather than to rank a student precisely within a domain.
Ways to use these reports
- Summative reporting to parents and guardians, and transition notes for the next teacher, at the end of the year.
- A diagnostic starting point at the beginning of the year, to catch retention gaps before planning the term.
- A single-sitting summary at the end of any term, to track progress between terms.
- A reference point for a student joining a school mid-year, alongside the rest of the cohort's existing data.
- Year-on-year tracking of the same assessment occasion, to monitor a cohort's progress through the school.
Downloading your data
You can access reports after one student has completed an assessment by clicking the 'Download reports' button in the Assessment Manager.

Note: Please be aware that after downloading a report during an open assessment window, you will be unable to download an updated report for 30 minutes.
Both PDF and CSV versions of every report are downloadable in-app.
- PDF reports are the student and cohort reports described above, ready to print or share at a department meeting or handover.
- CSV exports come in two formats:
- Raw data – one row per question attempt, including the student, the topic and question name, when it was answered, and whether it was correct. Useful if you want to build your own analysis.
- Summary data – one row per student's attempt, with their overall stats plus a correct count and percentage for every topic as separate columns. Useful for combining with your MIS data or building a school-wide tracker.
Getting started
For more on the assessments themselves, see our Introduction to Baseline Assessments or Introduction to End of Year Assessments pages. For help setting up assessments, see this help page.